Over the last decade, PSC has researched and implemented numerous water affordability and assistance projects.
We are often called upon to use our deep expertise in public policy development and data analysis to help water utilities and policymakers better understand the need, reach and costs related to addressing water affordability for people in Michigan.
In summer 2023, our team compiled and analyzed water and sewer utility rates in 470 communities across all 83 Michigan counties to identify the average costs of household water utility bills and the gap payment amounts necessary to achieve affordable water rates for all.

Lessons From Top-performing Water Utilities
PSC examined the ways water utilities are successfully anticipating and meeting customer needs through innovative strategies designed to reduce cost burdens, increase infrastructure investments and provide affordable services for everyone.
Financial Support for Sustainable Operations
Many of the serious issues with Michigan’s water and wastewater systems are the result of underinvestment in critical water infrastructure. PSC worked with The Nature Conservancy to explore solutions to assist utilities with asset management planning and technical assistance.
PSC partnered with Great Lakes Now and Detroit Public TV to bring together two staunch advocates of Michigan’s vast water supply, Rep. Dan Kildee and Macomb County Public Works Commissioner Candice Miller, for a conversation on the critical need for water infrastructure investments.
Water affordability analysis
To get the broadest sense of water affordability in Michigan, PSC was able to compile water rate data representing approximately 69% of the state’s population and ensured at least one utility from all 83 counties was accounted for in the data.
To estimate the number of households that would qualify for a water assistance program, PSC compiled and analyzed American Community Survey Public Use Microdata Sample to account for several factors including household size, poverty level, income, and water service charges in their estimates. [1]
The determination of gap payment eligibility was guided by the parameters set in proposed legislation that households with incomes below 135% of the federal poverty level must have a combined water and sewer bill that is less than 2% of their income. Those with incomes between 136% to 200% of the FPL must have a combined water and sewer bill that is less than 3% of their household income. Read more about our methodology.
Statewide program estimates
A county-level analysis included looking at households under 200% of the federal poverty level that received a water bill, considering household size by FPL. We found that when accounting for household size and usage of 50 gallons per person per day, average monthly bills ranged from $33 to $174, with an average of $72.
The determination of gap payment eligibility was guided by the parameters that households with incomes below 150% of the FPL must have a combined water and sewer bill that is less than 2% of their income. Those with incomes from 150% to 200% of the FPL must have a combined water and sewer bill that is less than 3% of their income. According to 2022 U.S. Census data, there were approximately 4,009,253 households in Michigan, of which roughly 30% were under 200% of the FPL.
| Total Qualified Households | Total Annual Gap Payments | Average Annual Gap Payment Needed per Household | Average Monthly Gap Payment Needed per Household |
| 371,522 | $161,780,647 | $435 | $36 |
Note: Calculations are made using PUMS estimates and water and sewer rate data collected from water utilities and analyzed by Public Sector Consultants. Stormwater drainage costs are not included.
Regional program estimates
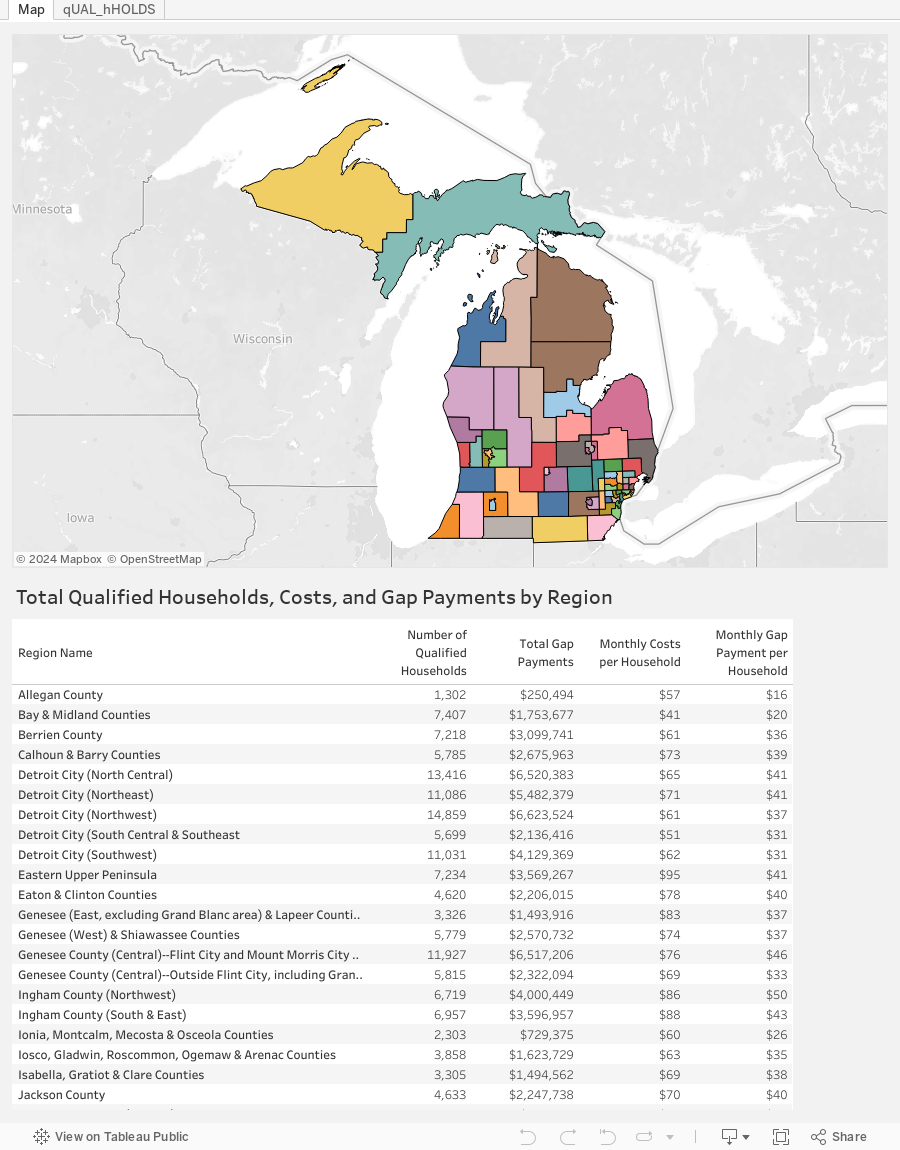
Water affordability varies across the state. Factors like location, household size, household income and utility costs can determine whether water and sewer costs are deemed affordable. The map below divides the state into regions and areas the U.S. Census Bureau designates as Public Microdata Use Areas. PSC used the PUMAs and the PUMS dataset to take a deeper look at what a water assistance program could mean for each of these areas related to program eligibility, participation and costs.[2]
By selecting a region or area of the map, the table below will show the total number of qualified households in that area, total area gap payments, their average monthly water and sewer costs, and the average monthly gap payment needed to make those costs affordable for qualified households in that area.
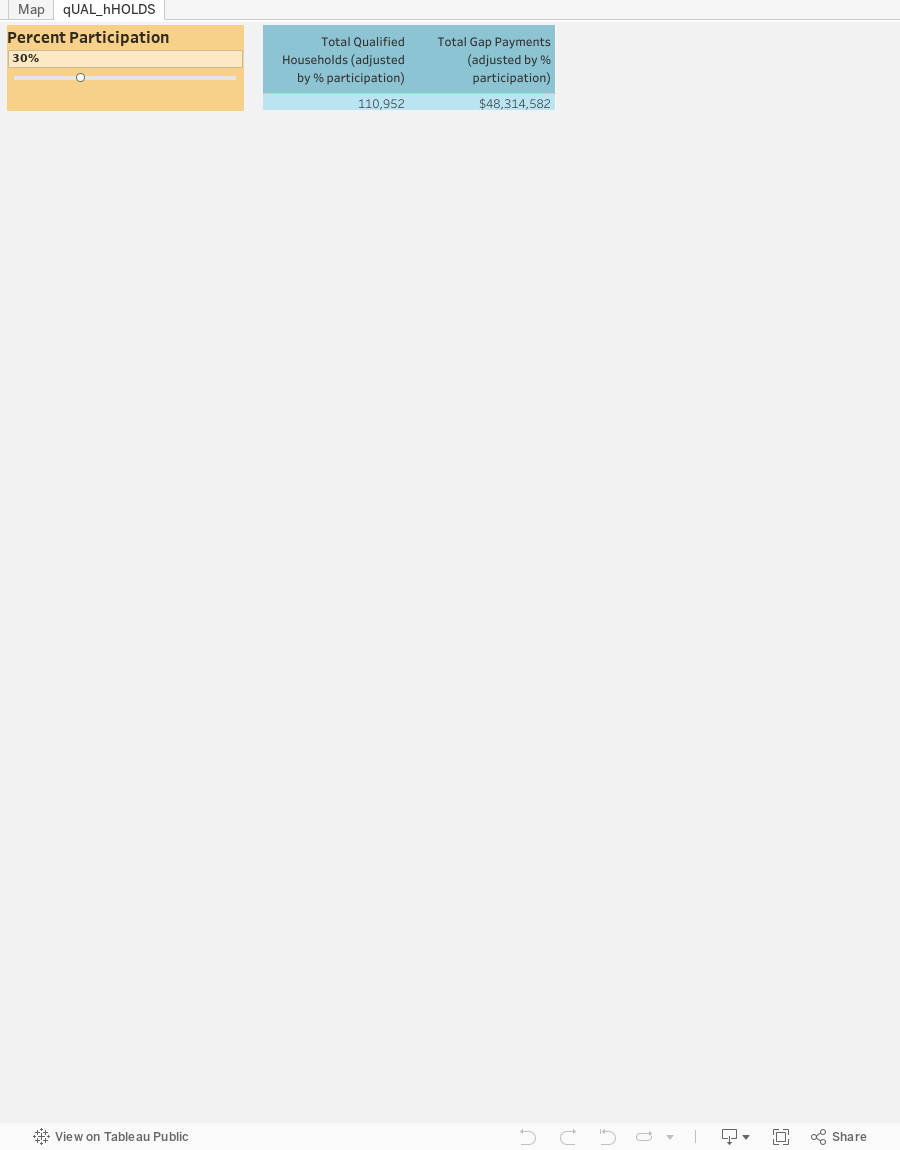
Program costs for a water assistance program are inherently dependent on the level of program participation from qualified households. In Michigan, utility assistance programs typically experience between 20% and 40% participation rates.[3] Use the sliding scale to adjust the percent participation to better estimate the statewide total number of qualified households and total gap payments for any level of program participation.
Funding a statewide water affordability program
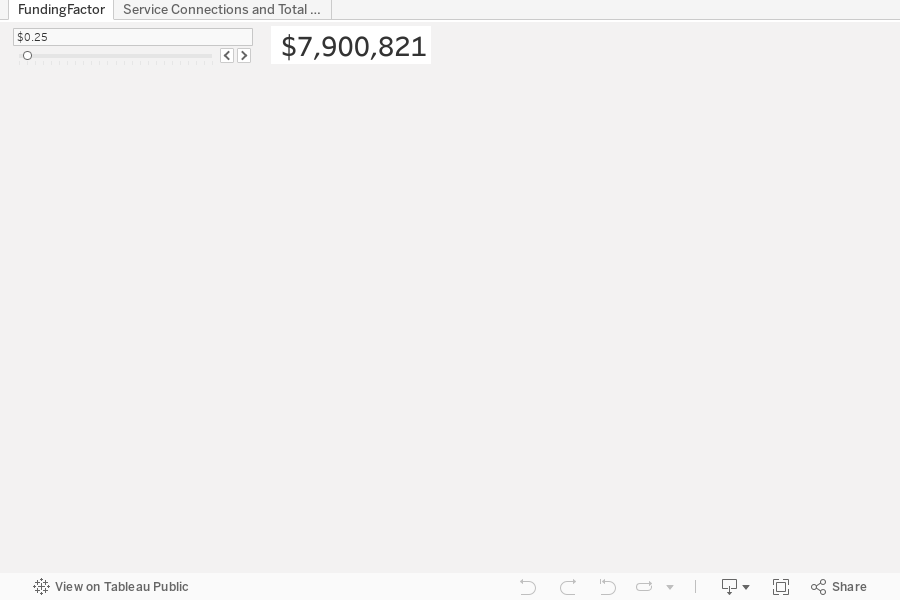
Based on PSC’s analysis, fully funding a statewide program that ensures affordable water costs for eligible households would cost approximately $162 million. In October 2023, the Michigan Legislature proposed setting a $2.00 funding factor for all 2.6 million retail water meters in the state, which would generate around $63 million annually. This amount would allow approximately 39% of potentially eligible households to benefit from the program.
The table below shows the total number of service connections per county and the estimated funding that would be generated if each connection was charged a monthly funding factor. You can use the sliding scale to adjust the amount of the funding factor to estimate total generated revenue at different funding levels.
Definitions
- Qualified households: Total number of households within the region or area that would qualify for the program based on proposed eligibility criteria — i.e., those below 200% of the FPL charged for water and sewer and with monthly water and sewer costs greater than 2% or 3% of monthly household income. It is important to note that qualified households are only those who pay for their water and sewer services AND have bills that are deemed unaffordable based on income. This is therefore a much smaller number than households experiencing poverty in any region.
- Total annual gap payment: Total payment necessary to cover the cost difference for all qualifying households in that region or area to reduce their water bill to an affordable rate (as defined above)
- Average monthly cost: The total average monthly cost for water and sewer based on 50 gallons per person per day using the compiled rate data; aggregated costs may not represent all water utilities in that region
- Average monthly gap payment: Average monthly difference between the water and sewer bill and the amount deemed affordable per qualifying household
Footnotes
[1] United States Census Bureau. 2022. “ACS 1-Year Estimates Public Use Microdata Sample.” United States Census Bureau. https://data.census.gov/mdat/#/search?ds=ACSPUMS1Y2022.
[2] PUMAs are geographic areas designated by the U.S. Census Bureau that partition each state or equivalent entity into geographic areas containing no fewer than 100,000 people each. United States Census Bureau. September 7, 2023. “Public Use Microdata Areas (PUMAs).” United States Census Bureau. https://www.census.gov/programs-surveys/geography/guidance/geo-areas/pumas.html
[3] Low Income Home Energy Assistance Program. n.d. “LIHEAP Data Warehouse.” U.S. Department of Health and Human Services. https://liheappm.acf.hhs.gov/datawarehouse/.