PSC is a bastion of proud geeks and wonks. At the heart of it all is our penchant for data-driven ideas that lead to thoughtful and implementable policy solutions. From analyzing community trends to evaluating program outcomes, our data team turns complex information into actionable insights that shape better public policy.
We sat down with Lauren Branneman, director of data science, to talk about how data informs our research projects, the tools we use to uncover insights and what projects we’re working on that get our data team out of bed in the morning.

Lauren Branneman
Director, Data Science and Economics
Question 1
How do we rekindle interest in gathering and understanding data before making policy decisions?
It’s important to get ahead of the curve when it comes to using data and analysis to drive decision making around policy or program development. Often there are preconceived notions or anecdotes that form strong ideas about the best course of action, and other times there is simply pressure to act quickly. In many of these situations, a solution is identified before any evidence is considered, and then data is sought out to support or justify the position. This backwards approach can lead to ineffective use of funds, poorly designed programs and policies and mistrust in our leadership bodies. The truth is that good policy and program development is born out of prudence and planning, which includes identifying the necessary data up front to support decision making.
Question 2
What’s an example of a project where your research or data analysis led to an insight that changed how a client approached a decision or impacted the outcome of an initiative?
A few come to mind, the first being our program evaluation for Michigan’s Tri-Share Child Care Program, which began as a pilot program with a unique public-private cost sharing approach to help more families afford licensed care. The data and research our team provided informed efforts to expand program participation by nearly 100 percent.
Another important and ongoing effort is our work evaluating the development of a statewide water affordability program that analyzes the intersection of household income and water utility rates across the state. Our evaluation assesses the need, cost, and impact of such a program that aims to provide relief for low-income Michigan families. These are examples of how good data and analysis has helped drive results and was utilized up front with careful planning.
Most recently, our analysis of the economic contributions of the Mackinac Bridge helped the Authority effectively communicate the bridge’s benefits across the local communities and state and continues to support their ongoing conversations with community leaders.
Question 3
What types of data or information gathering do you use the most at PSC, and how does your team ensure it’s accurate and reliable?
There’s many sources to choose from, depending on the client and their specific needs. We use a range of data sources that are both publicly available or accessible through private data vendors and our clients (such as organizational or programmatic data). We also utilize primary research through surveys if there are no data available to support the research requested.
We regularly use sources like the Census Bureau, Bureau of Labor Statistics, and the Bureau of Economic Analysis — but sometimes our clients have questions that require more unique approaches or highly granular data. In these cases, we leverage resources like IMPLAN for economic analyses, Esri’s ArcGIS geospatial software, Placer.ai’s foot traffic analytics, or Lightcast for labor market data points.
Accuracy, reliability, and integrity of information are of great importance to our team and our clients. We always approach our analyses thoughtfully to ensure we answer the questions with sound methods.
We approach each of our projects with four key aspects to ensure integrity of our work:

Understanding our sources and what each data point represents

Quality assurance and quality control checks

Corroborative data and information

Detailed documentation of methods
Question 4
How does PSC translate complex data into insights that policymakers and the public can actually use?
We work to strike a careful balance between communicating findings accurately and making them accessible to the general public, which is why it’s important to hire a consultant with the right expertise and experience. There’s a quote widely attributed to Albert Einstein: “If you can’t explain it simply, you don’t understand it well enough,” and I believe that’s true. That said, highly technical language and lengthy reports can be useful and even necessary in some settings.
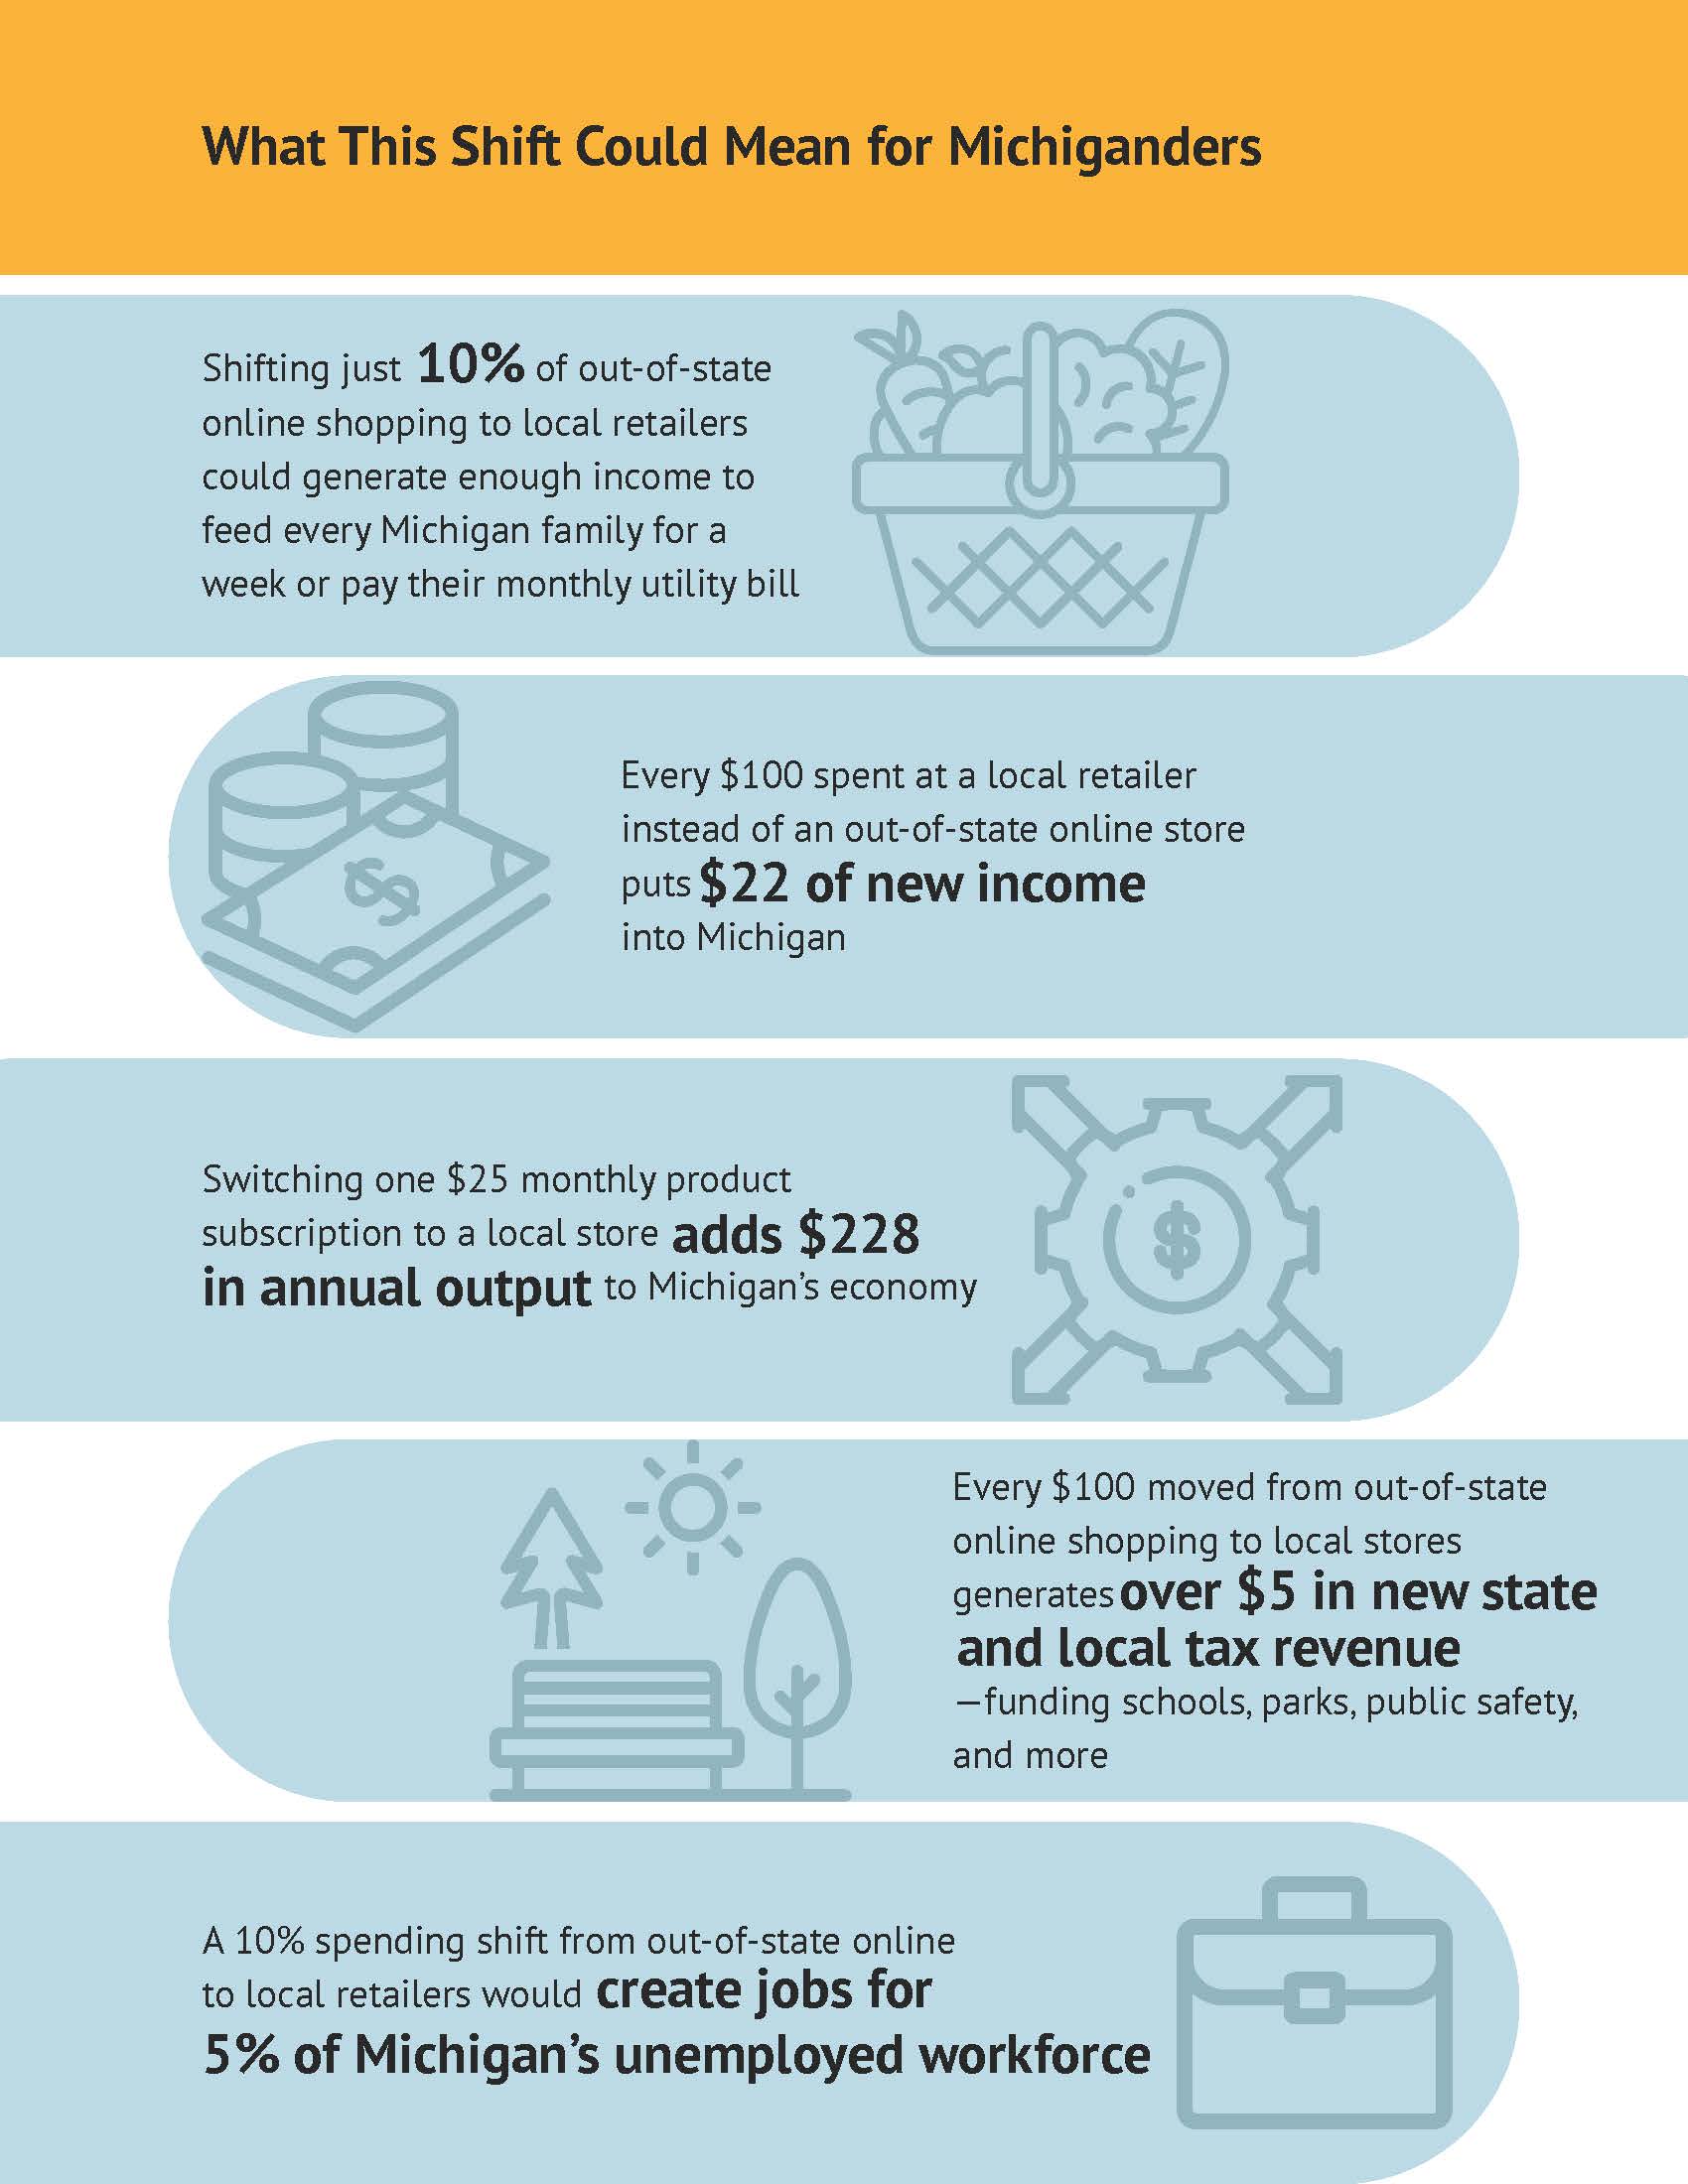
When technical language muddies the message, our team can produce other takeaways and support materials to transform the technical jargon into understandable, everyday language that resonates with its intended audience. We often produce highly graphic visuals (think one-to-two page infographic-style executive summaries) so our clients can share the most important insights with broad audiences. I’ve also found that people are generally drawn to visuals, maps, storytelling and relatable examples that resonate with everyday life. These can help simplify the message and convey key insights in an engaging way.
We regularly use sources like the Census Bureau, Bureau of Labor Statistics, and the Bureau of Economic Analysis — but sometimes our clients have questions that require more unique approaches or highly granular data. In these cases, we leverage resources like IMPLAN for economic analyses, Esri’s ArcGIS geospatial software, Placer.ai’s foot traffic analytics, or Lightcast for labor market data points.
Accuracy, reliability, and integrity of information are of great importance to our team and our clients. We always approach our analyses thoughtfully to ensure we answer the questions with sound methods.
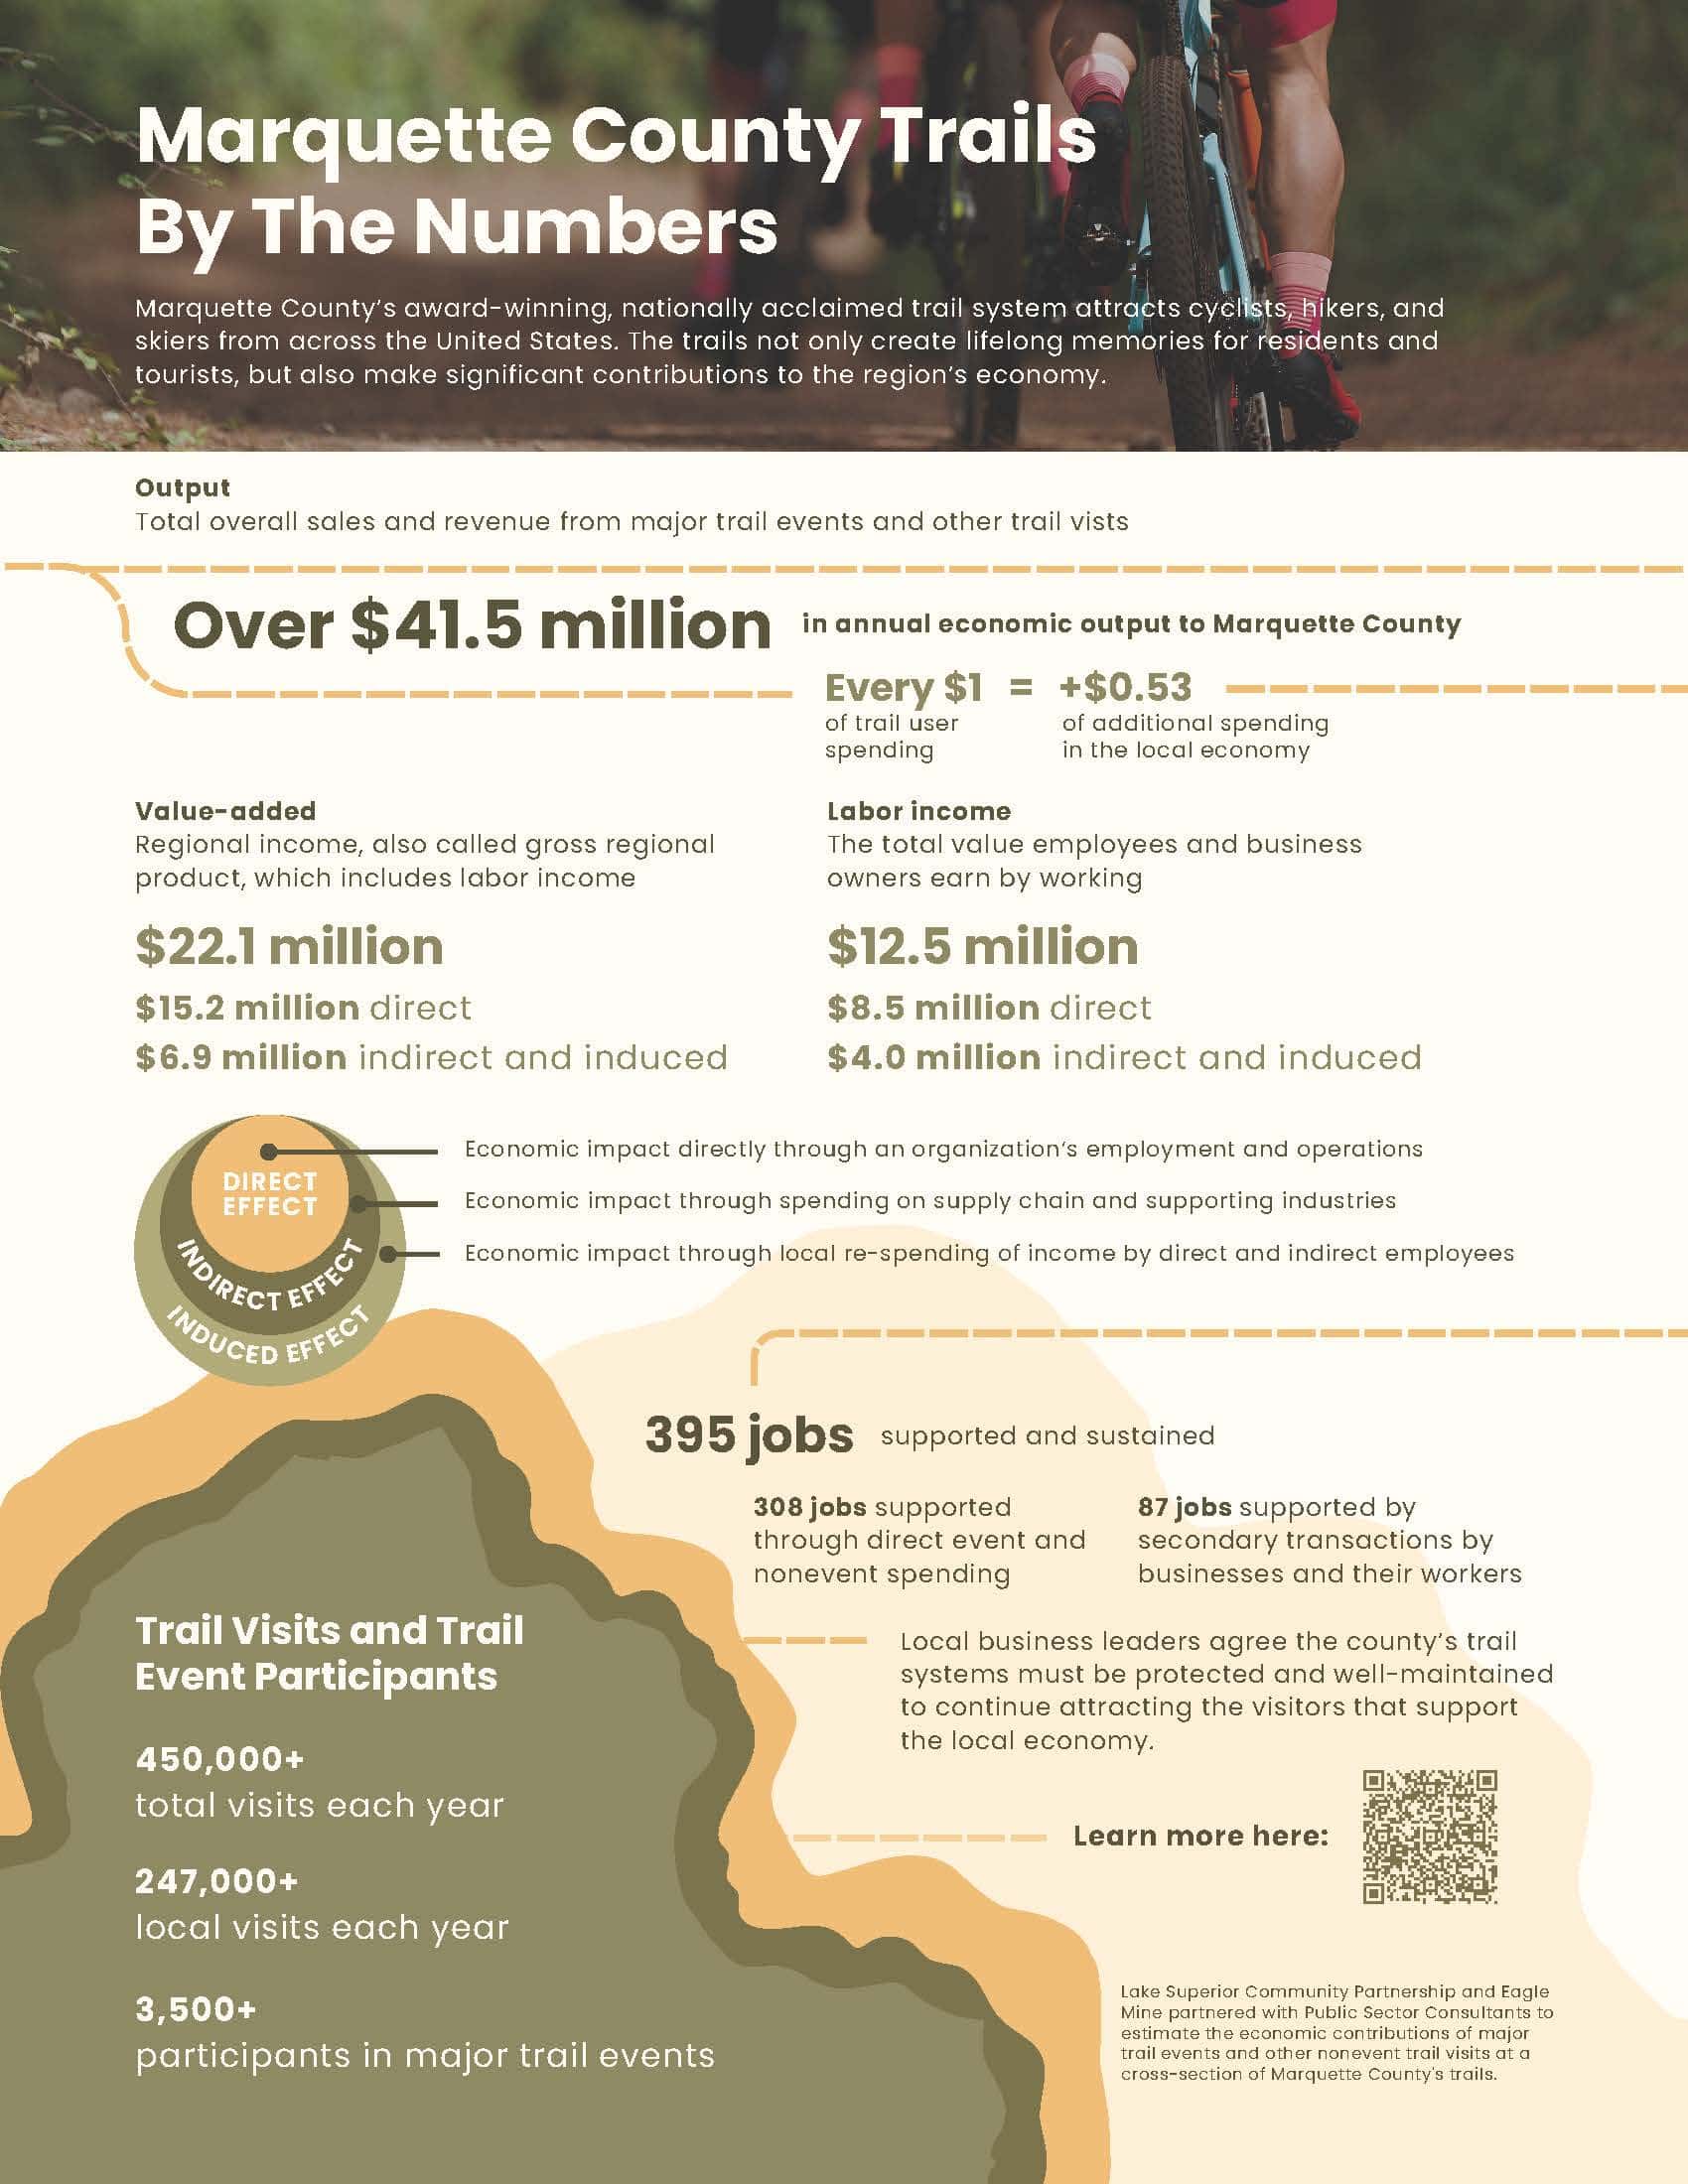
Examples of our visual executive summaries


Question 5
What skills or services does PSC’s data science team offer that clients might not be aware of?
Over the last few years we’ve done more work in the tourism and visitation analytics space. Most recently, we completed work assessing the economic contributions of the Mackinac Bridge, Potter Park Zoo and Marquette Trails. We also estimated the economic impact of the Mackinac Bridge Walk event that takes place every Labor Day.
Our team loves this kind of work, and we enjoy piecing data puzzles together to tell the story of how our economy responds when people and organizations engage with various types of businesses. This specific kind of work also allows us to showcase some of the unique ways we leverage data through tools like Placer.ai or Datafy, which are location analytics interfaces that use cell phone and credit card data to estimate foot traffic, visitor origins and travel and spending patterns across various local destinations.
We’re also very interested in doing more in the workforce and talent pipeline assessment space. It’s a subject that is talked about widely across the state, and for good reason. My 10 years at the Michigan Economic Development Corporation before I joined PSC provided me with the opportunity and skills to help businesses and organizations understand where there are gaps in our workforce, how our educational pipeline is addressing (or should address) future workforce demand and how AI may impact some of the jobs our economy relies upon.
Extra Credit
Is there a recent project or data-driven decision that you’re excited about?

The benchmarking project we did for the Business Leaders for Michigan was a favorite of mine. It was data-rich, and our team was able to pinpoint areas of the national economy in which Michigan leads or lags, and what it would take to get our state into the Top Ten. Benchmarking work is always a fun challenge because it takes a lot of client collaboration to ensure the indicators are appropriate for the questions being answered, and there is a lot of research done to weave a meaningful story together about what each state ranking means, what policies may have led to a ranking, and what could be done in the future to address growth. Plus, we all want to see Michigan thrive!
Data-informed public policy for the real world
Public policy is most effective when it’s informed by real-world evidence.
Our data science team makes that possible. We transform raw numbers into information and stories that inspire action and meaningful change.
Want to see how our insights can support your next initiative?